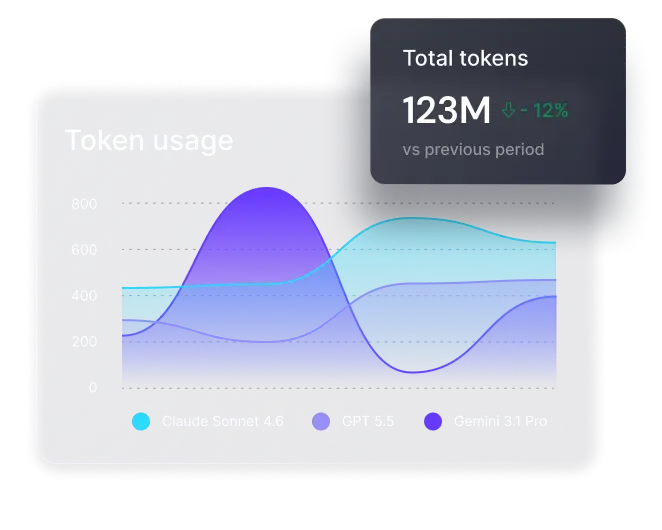
See usage by team, project, and user
Track requests, tokens, models, and API keys per team, user, or project.
Gain complete visibility into how AI is used across your organization – from shadow tools and prompts to Gateway-level traffic, performance & spend.
Chosen by leading engineering teams

🔥 Observer
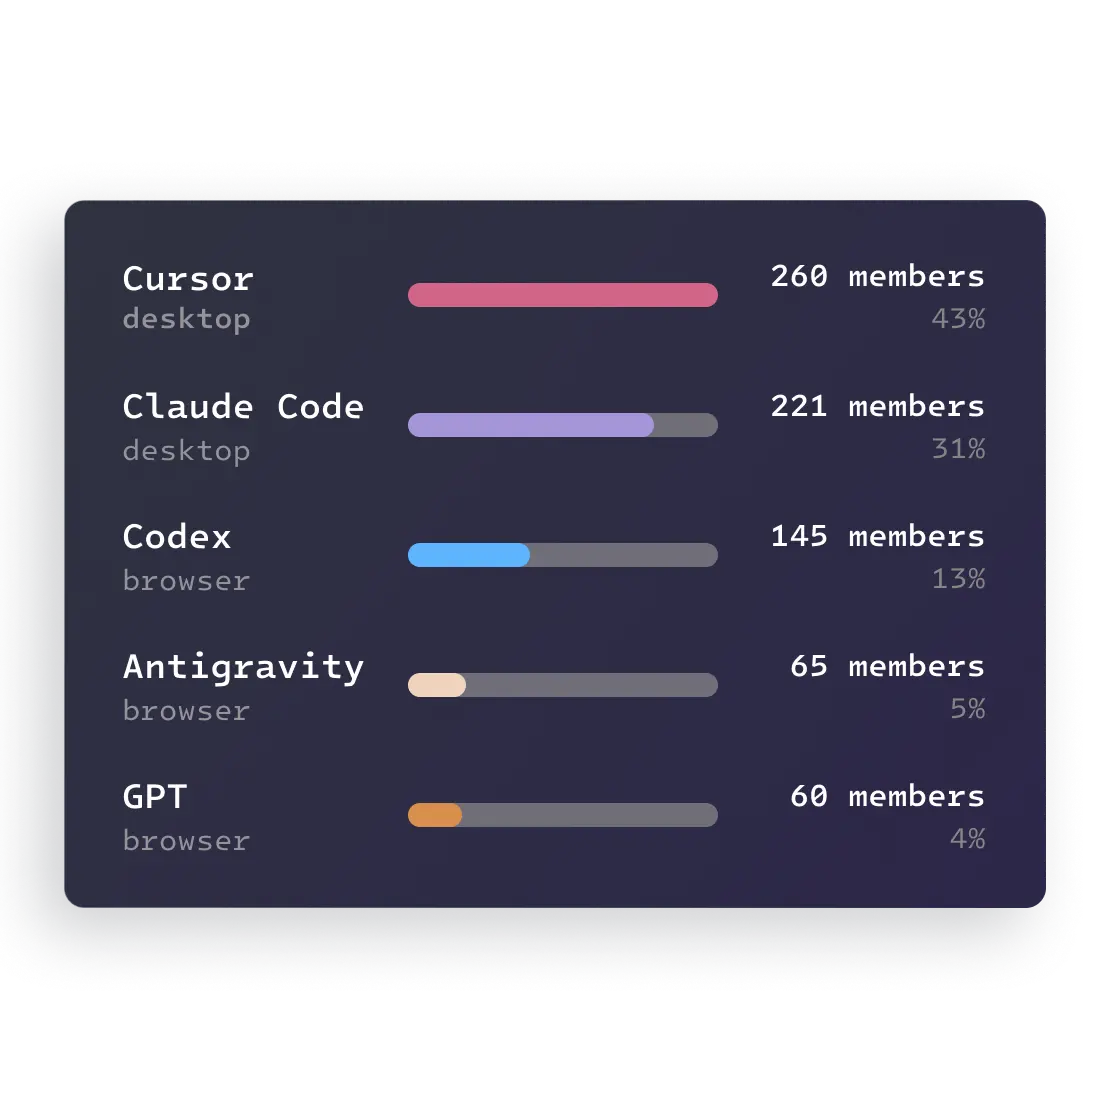
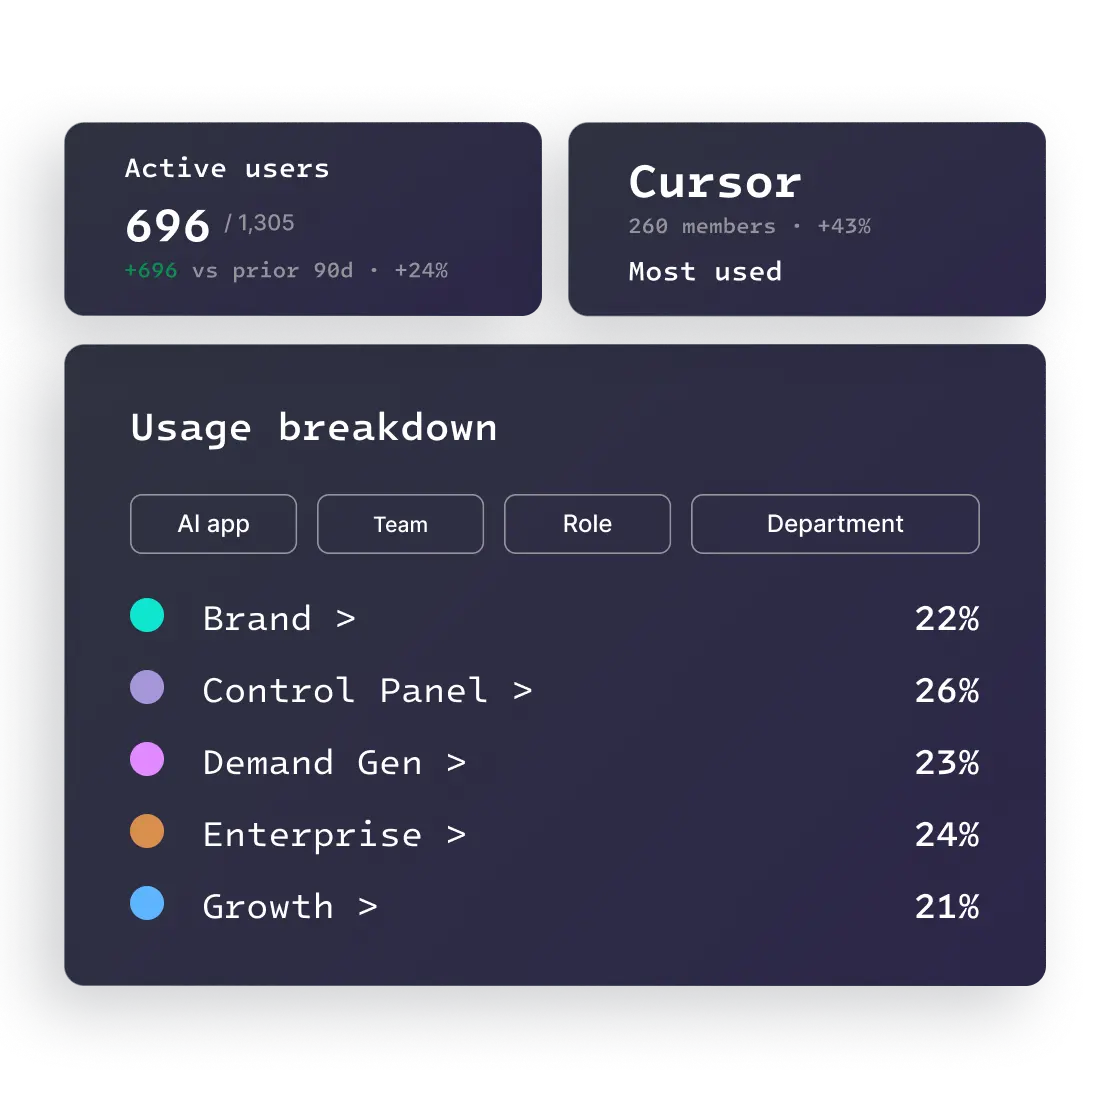
From ChatGPT in the browser to Cursor and Claude Code on the desktop, all tracked.
Tools outside your approved list, flagged and ranked by risk.
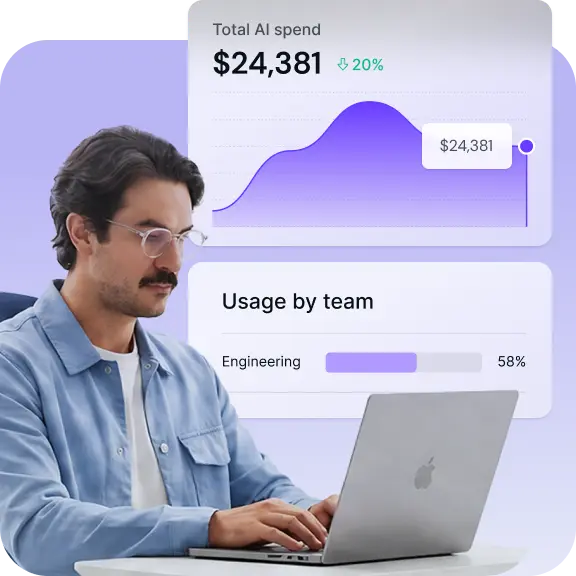
Which teams use AI most, what it costs, and the ROI you're getting
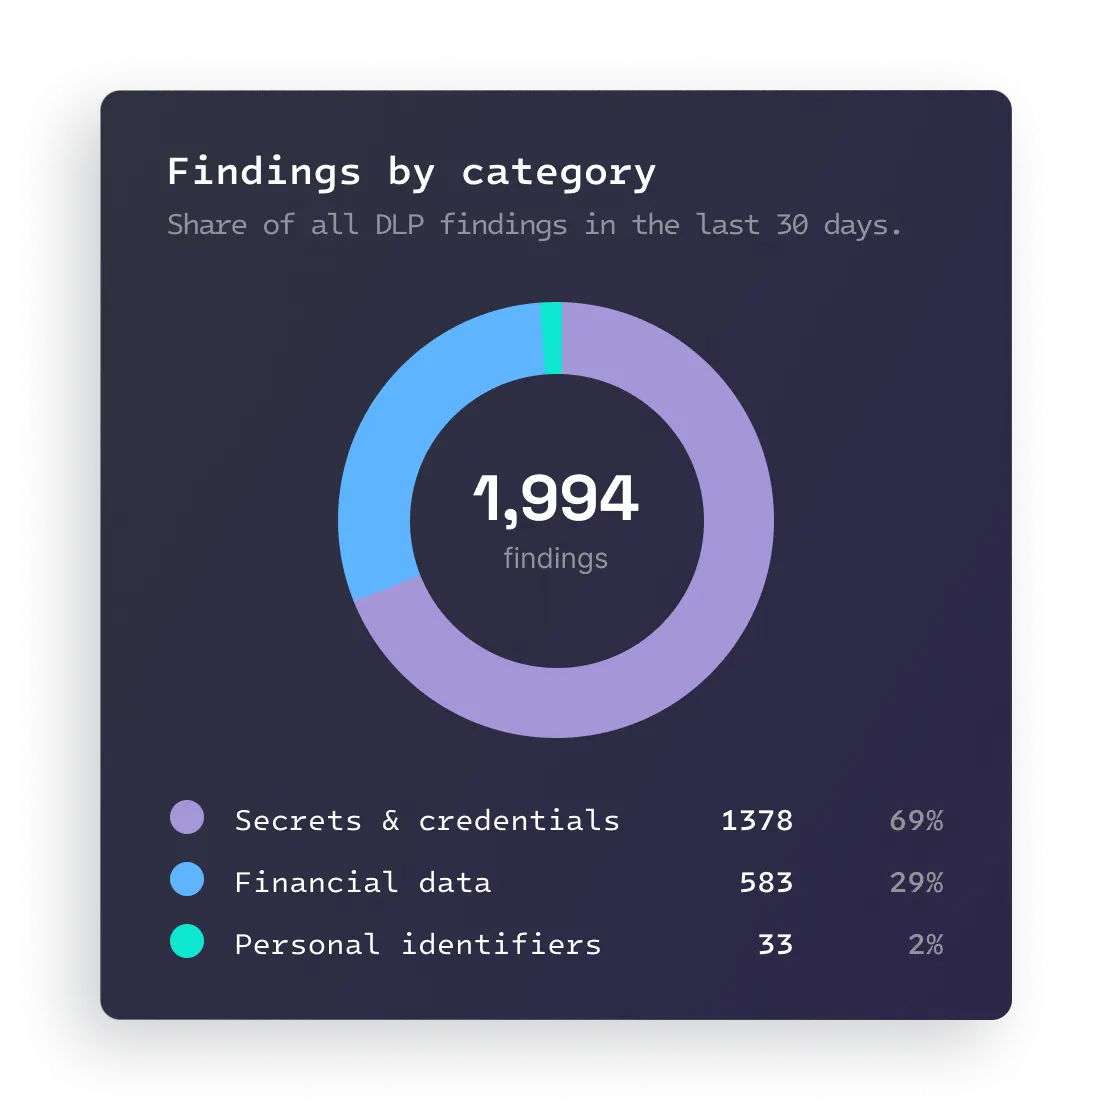
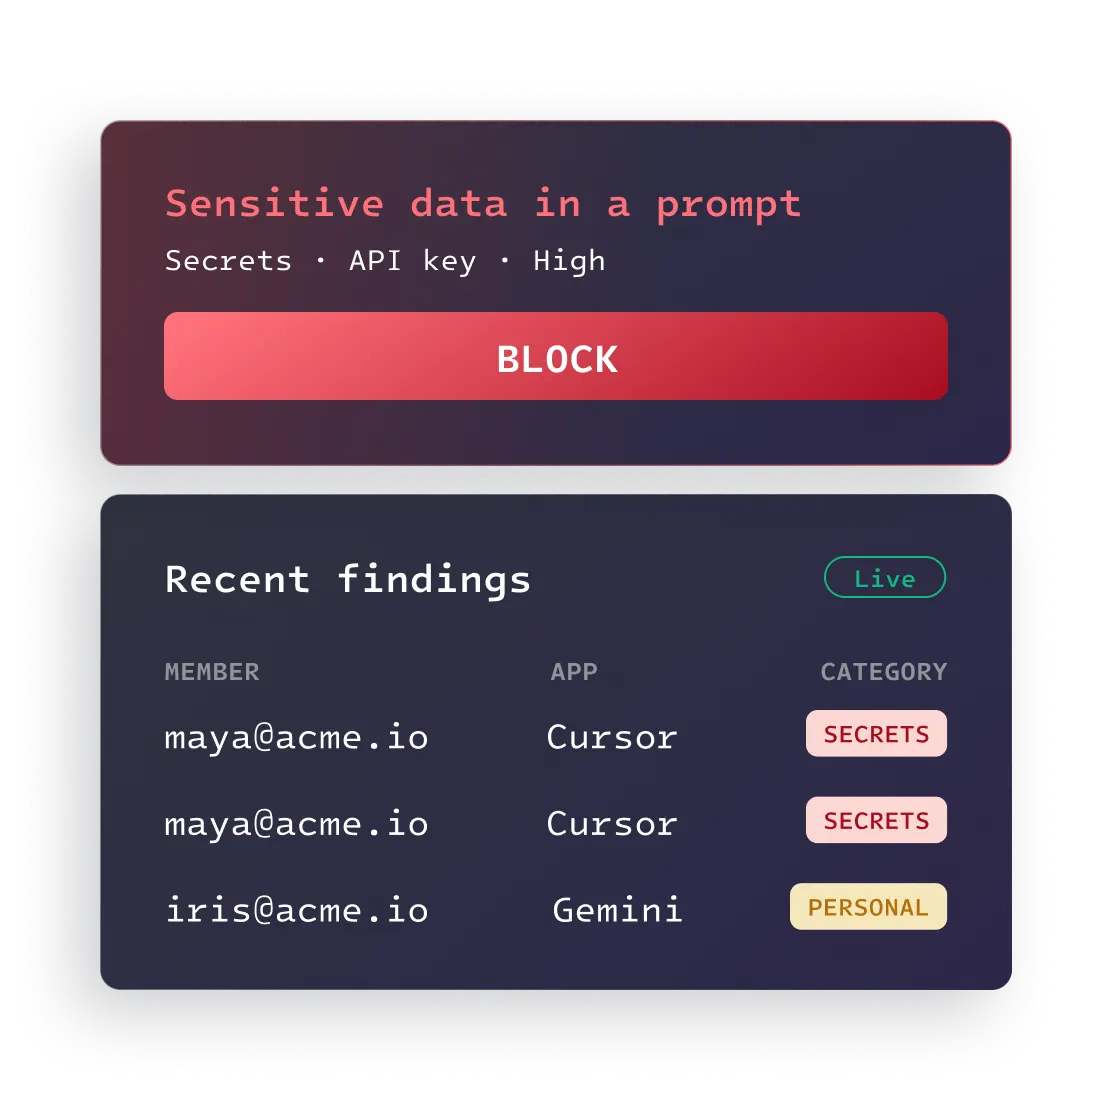
Sensitive data, blocked before it leaves your business.
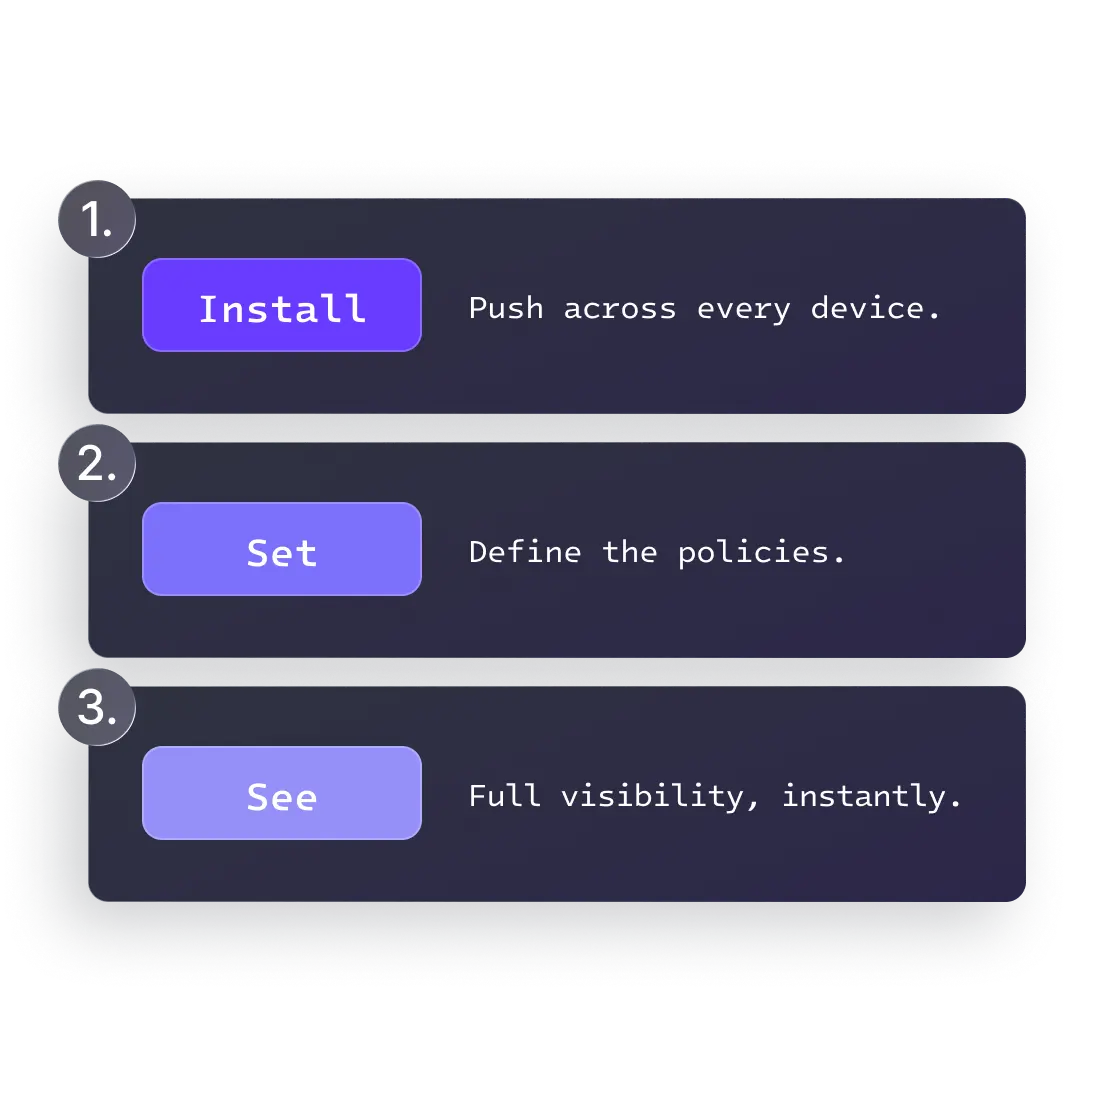
No setup or disruption for your team, just instant visibility into AI usage.
🔥 Observer
Your workspace, the devices it licenses, and who can reach the console.
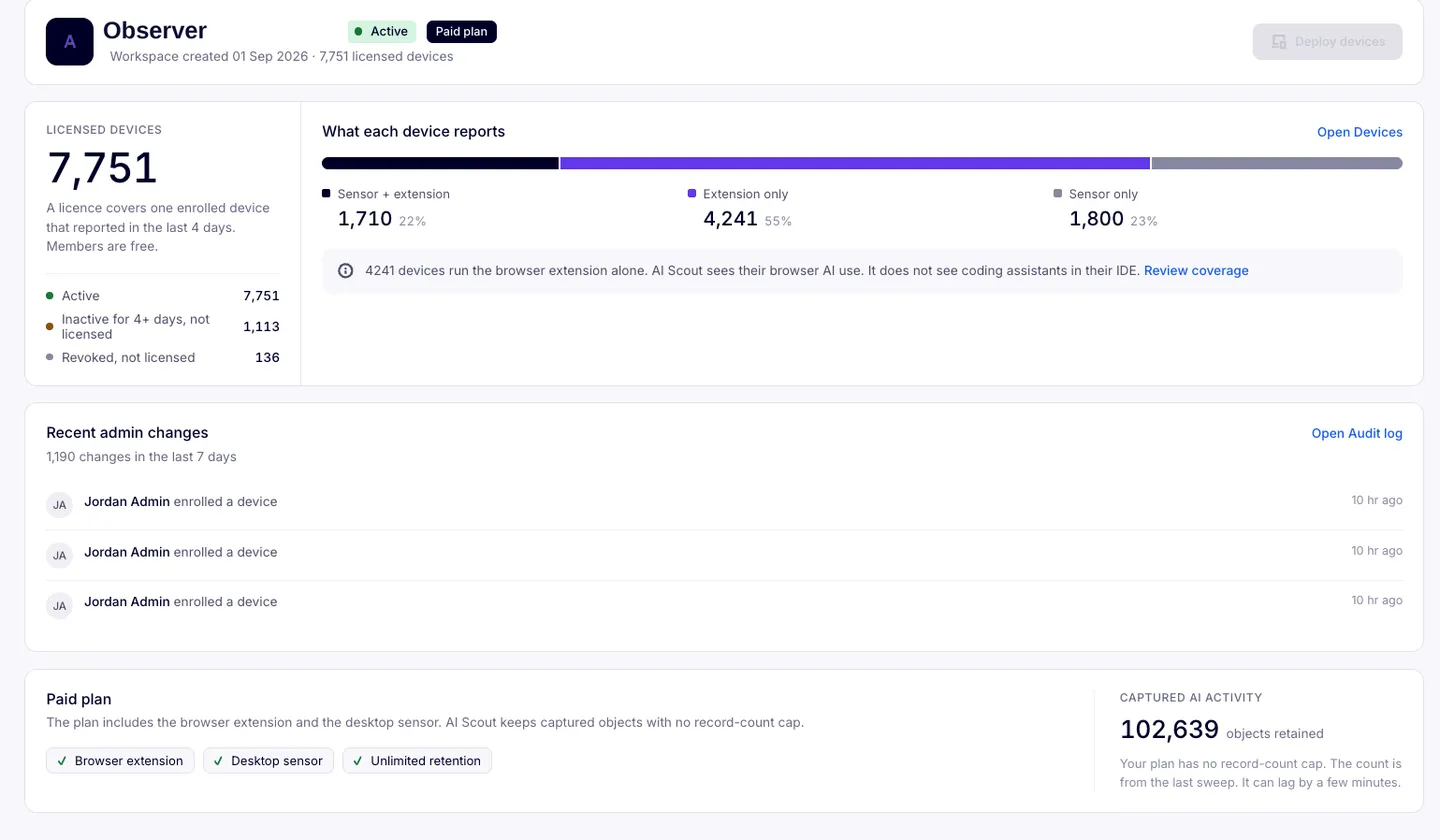
NexEco AI gives you one place to monitor how AI is being used so you can optimize model choices, caching habits, spend controls, and more.
Track requests, tokens, models, and API keys per team, user, or project.
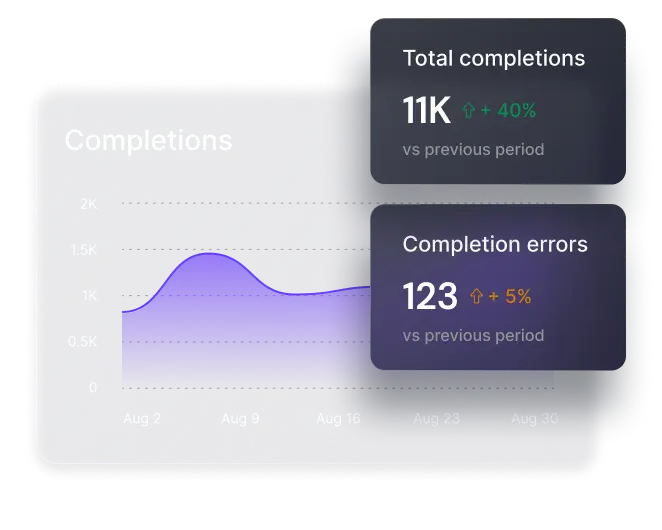
Monitor latency, errors, and throughput across models and providers.
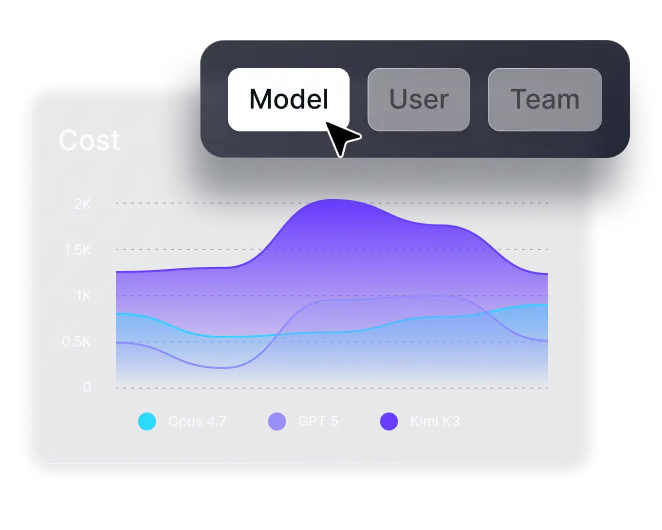
Break down spend by model, application, project, team, user, API key, and individual request.
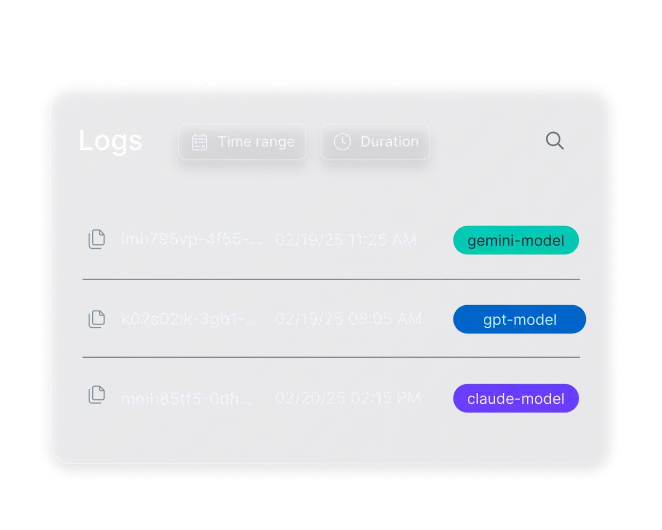
Use logs and traces to see tokens, latency, routing decisions, cache behavior, costs, and errors behind any request.
AI observability isn’t just for technical teams. It’s a business-critical layer that gives security, finance, and visibility into how AI is used, what it costs, and where issues or risks emerge.
Spot policy violations, unusual usage, and potential risks with visibility into AI activity across your organization.
See exactly what AI is costing you, by team, tool, and project, and cut unnecessary spend wherever it happens.
Show stakeholders and regulators how AI is being used, and what protections are in place. Logs and reports make your policies verifiable, not just theoretical.
See which teams are actually using AI day to day, not just who has a license, so you can prove your rollout is working.
When you can’t see how AI is being used, you can’t control the risks it creates. Blind spots in your AI stack and infrastructure create serious LLM challenges — from data leaks to runaway costs: